Politics
How Many People Live in a Political Democracy Today?
Article/Editing:
How Many People Live in a Political Democracy Today?
Governments come in all shapes and sizes, but can ultimately be divided into two broad categories: democracies and autocracies.
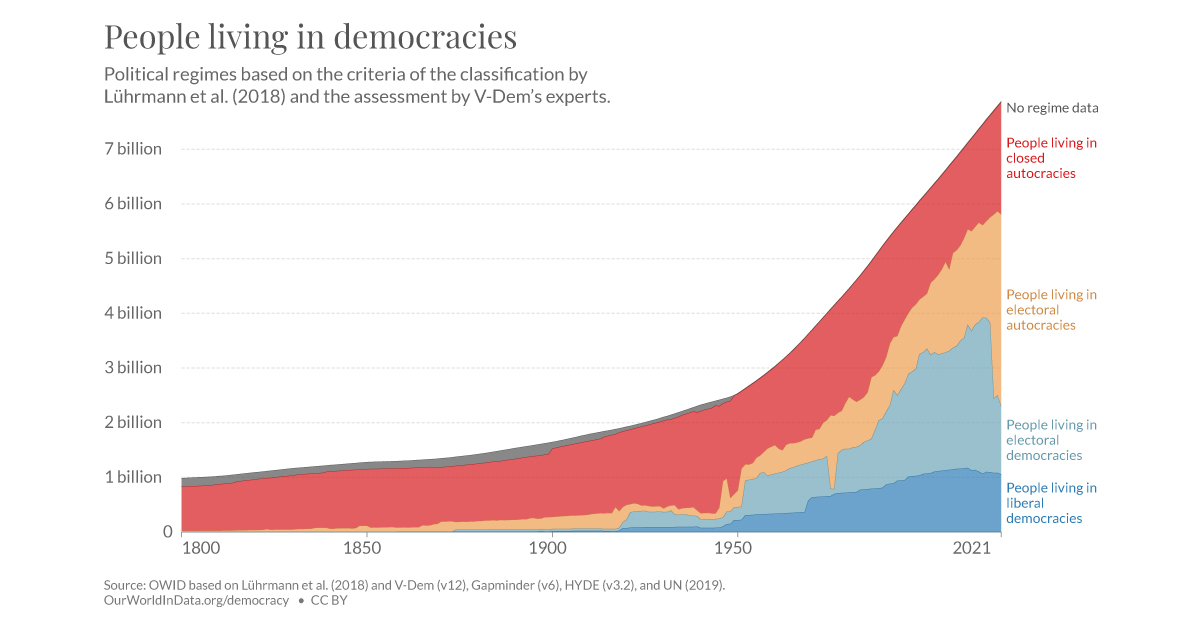
Using the Regimes of the World classification system developed by political scientists Anna Lührmann, Marcus Tannenberg, and Staffan Lindberg and data from V-Dem, it’s estimated that 2.3 billion people—about 29% of the global population—lived in a democracy in 2021.
By contrast, 71% of people lived under what can be considered an autocratic regime. In fact, the number of people considered to be living under a type of autocracy is at its highest total in the last three decades.
To see how this split has changed over time, the chart from Our World in Data, which uses data from the aforementioned sources, highlights how many people have lived under political democracies versus autocracies since the 18th century.
Forms of Political Democracies and Autocracies
First, let’s look at the four types of political regimes shown in the chart, based on criteria from the classifications of Lührmann et al. (2018):
- Liberal democracies: Judicial and legislative branches have oversight of the chief executive, rule of law, and individual liberties.
- Electoral democracies: Hold multiparty de-facto elections that are free and fair, have an elected executive, and institutional democratic freedoms such as voting rights, clean elections, and freedom of expression.
- Electoral autocracies: Hold de-facto elections; democratic standards are lacking and irregular.
- Closed autocracies: No elections are held for the chief executive or no meaningful competition is present.
It’s important to note that this is a fairly stringent and specific classification system. Many countries consider themselves an electoral democracy or strive to appear as one, but are still considered autocratic based on this criteria.
Using this categorization scheme, 34 countries can be considered liberal democracies, 55 are electoral democracies, 60 are electoral autocracies, and 30 are closed autocracies as of early 2022.
Over 200 Years of People Living in a Political Democracy
Many political systems around the world have made clear transitions in the last two centuries, but even in the last decade they’ve shifted substantially.
In 2010, the global population was split about 50/50 between democratic and autocratic regimes. Since then, there has been a clear trend towards autocratization.
| Year | % Democracy | % Autocracy |
|---|---|---|
| 2021 | 29.3% | 70.7% |
| 2010 | 50.4% | 49.6% |
| 2000 | 53.6% | 46.4% |
| 1990 | 41.4% | 58.6% |
| 1980 | 34.1% | 65.9% |
| 1970 | 34.9% | 65.1% |
| 1960 | 35.2% | 64.8% |
| 1950 | 18.1% | 81.9% |
| 1940 | 10.4% | 89.6% |
| 1930 | 17.9% | 82.1% |
| 1920 | 12.0% | 88.0% |
| 1910 | 3.7% | 96.3% |
| 1900 | 3.6% | 96.4% |
| 1890 | 3.5% | 96.5% |
| 1880 | 3.5% | 96.5% |
| 1870 | 0.4% | 99.6% |
| 1860 | 0.3% | 99.7% |
| 1850 | 0.2% | 99.8% |
| 1840 | 0.0% | 100.0% |
| 1830 | 0.0% | 100.0% |
| 1820 | 0.0% | 100.0% |
| 1810 | 0.0% | 100.0% |
| 1800 | 0.0% | 100.0% |
Note: Missing regime data not included
Though modern democracies have roots in the 1700s and 1800s in Europe and the United States, governments have only more recently been able to check the boxes of the stringent democratic criteria highlighted above.
According to the data, liberal democracies and electoral democracies only emerged in Switzerland and Australia in the 1850s and in France in the 1870s after the Franco-Prussian war.
Following both World Wars, the number of democracies in the world increased, spreading across Europe, Latin America, and parts of Asia. After the Cold War, countries across Eastern Europe also adopted democracies, with the total populations shown in the table below.
| Year | Liberal Democracy | Electoral Democracy | Electoral Autocracy | Closed Autocracy |
|---|---|---|---|---|
| 2021 | 1.05B | 1.25B | 3.51B | 2.05B |
| 2010 | 1.16B | 2.34B | 1.75B | 1.70B |
| 2000 | 1.06B | 2.22B | 1.02B | 1.82B |
| 1990 | 865.52M | 1.33B | 999.81M | 2.12B |
| 1980 | 722.40M | 796.11M | 957.93M | 1.97B |
| 1970 | 632.53M | 655.49M | 439.89M | 1.96B |
| 1960 | 334.08M | 730.90M | 528.14M | 1.43B |
| 1950 | 217.75M | 239.01M | 306.07M | 1.76B |
| 1940 | 74.46M | 156.01M | 113.89M | 1.87B |
| 1930 | 89.64M | 274.29M | 67.96M | 1.60B |
| 1920 | 70.22M | 152.50M | 275.10M | 1.36B |
| 1910 | 20.74M | 41.46M | 261.16M | 1.34B |
| 1900 | 13.70M | 40.82M | 222.36M | 1.25B |
| 1890 | 6.00M | 40.19M | 179.48M | 1.11B |
| 1880 | 5.03M | 38.73M | 158.42M | 1.05B |
| 1870 | 4.41M | 0 | 188.65M | 992.35M |
| 1860 | 3.80M | 0 | 83.33M | 1.08B |
| 1850 | 2.38M | 0 | 113.98M | 1.03B |
| 1840 | 0 | 0 | 62.01M | 1.04B |
| 1830 | 0 | 0 | 47.54M | 986.50M |
| 1820 | 0 | 0 | 37.75M | 921.85M |
| 1810 | 0 | 0 | 25.74M | 847.04M |
| 1800 | 0 | 0 | 22.00M | 805.81M |
Note: Missing regime data not included
On the flipside, it’s estimated that 5.5 billion people live in autocratic countries.
Electoral autocracies make up the majority of this total, with 3.5 billion people or about 45% of the global population today. Russia, Turkey, and Venezuela are considered electoral autocracies, as well as India since 2019.
Closed autocracies are the second-most common, and in the last decade, the number of closed autocracies rose from 25 to 30 countries.
One report estimates that as much as 20% of European countries are autocratizing as of 2021, including Hungary, Greece, Poland, and Croatia.
Changes in Political Systems
What countries became more autocratic in 2021, and why?
Coups, involving the overthrow of a government in power, played a large role behind the most recent autocratic shifts. Of the five coups that occurred in 2021, four—Chad, Mali, Guinea, and Myanmar—became classified as closed autocracies. Meanwhile, Nigeria, Tunisia, and El Salvador became classified as electoral autocracies.
Meanwhile, Austria, Portugal, Ghana, and Trinidad & Tobago shifted from liberal democracies to electoral democracies, as the transparency of laws and enforcement waned.
Moving in the opposite direction, both Armenia and Bolivia started being classified as democracies in 2021.
Current Obstacles
Reinforcing the current shift to autocracies is increasing polarization around the world. Research shows that political polarization is linked with democratic decline. Since 1950, 26 of the 52 instances of countries facing deep polarization saw their democratic systems downgraded.
At the same time, misinformation reinforces polarization. With democratic institutions facing headwinds, it remains unclear if current autocratic trends will continue.

This article was published as a part of Visual Capitalist's Creator Program, which features data-driven visuals from some of our favorite Creators around the world.


United States
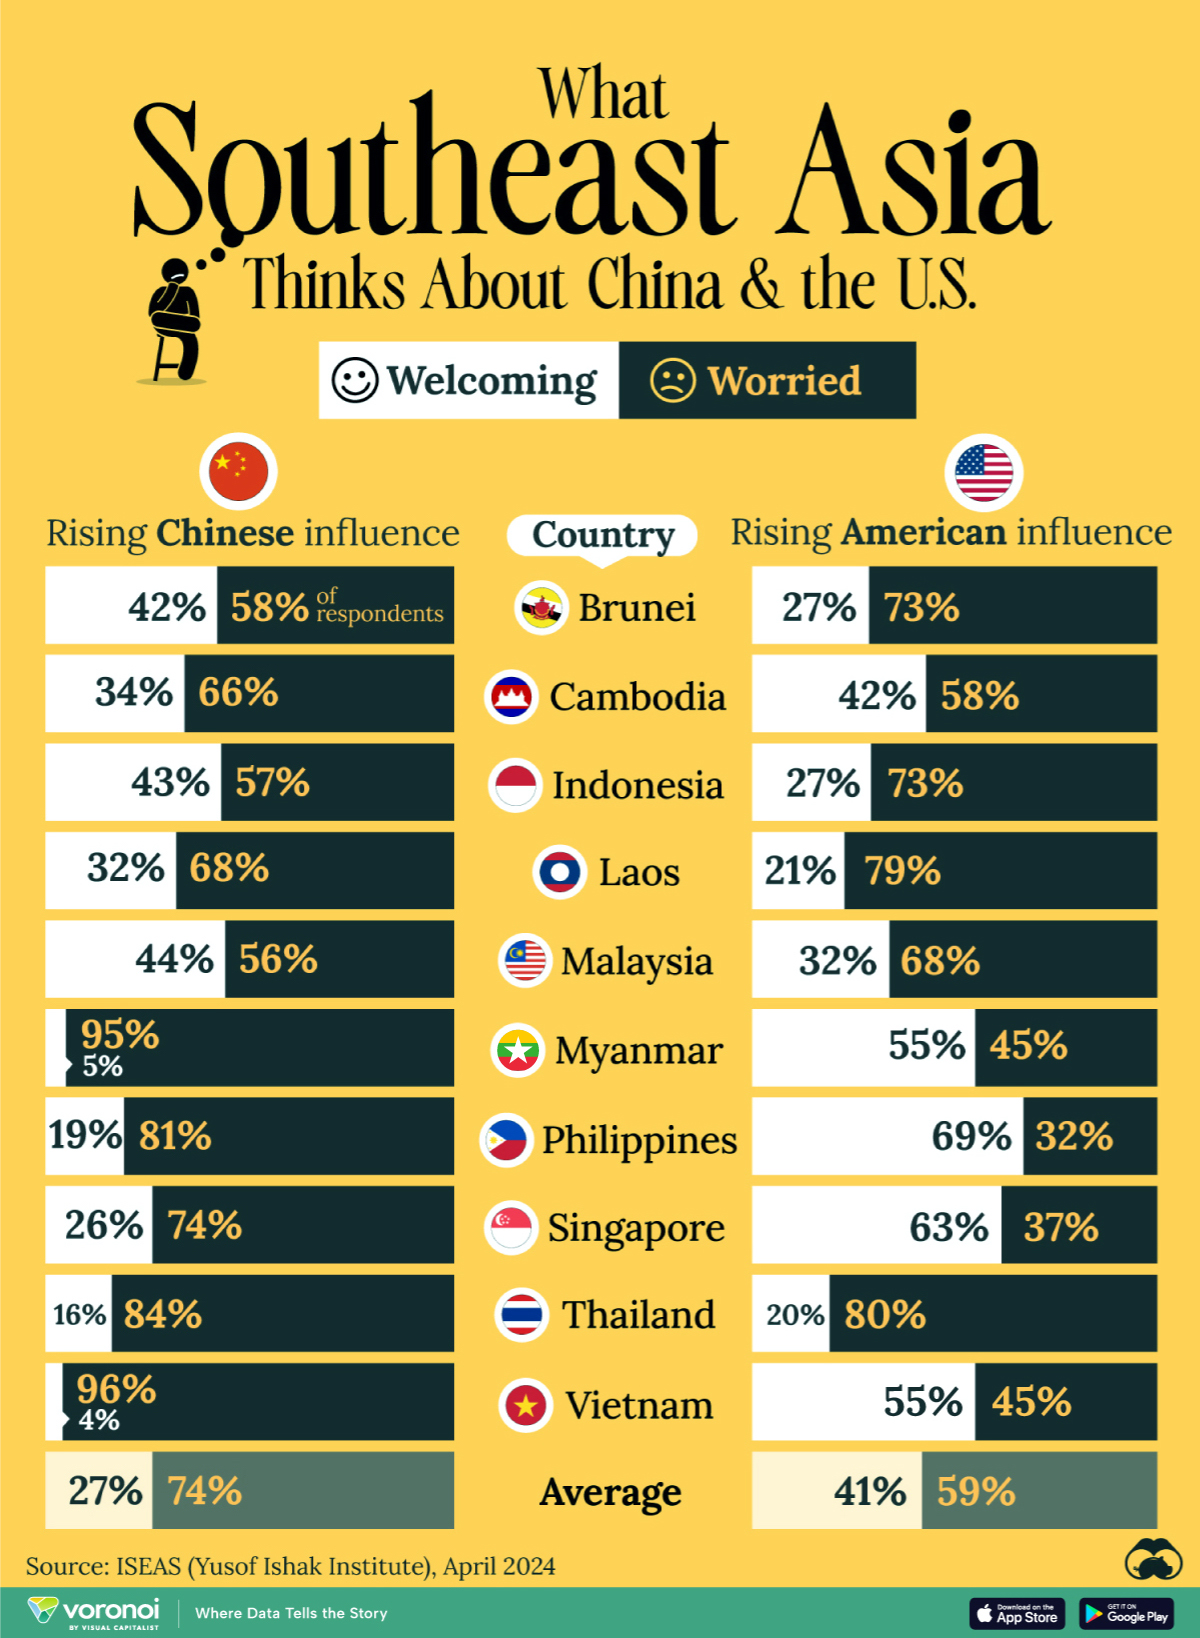
Charted: What Southeast Asia Thinks About China & the U.S.
A significant share of respondents from an ASEAN-focused survey are not happy about rising American and Chinese influence in the region.
What Southeast Asia Thinks About China & the U.S.
This was originally posted on our Voronoi app. Download the app for free on iOS or Android and discover incredible data-driven charts from a variety of trusted sources.
This chart visualizes the results of a 2024 survey conducted by the ASEAN Studies Centre at the ISEAS-Yusof Ishak Institute. Nearly 2,000 respondents were asked if they were worried or welcoming of rising Chinese and American geopolitical influence in their country.
The countries surveyed all belong to the Association of Southeast Asian Nations (ASEAN), a political and economic union of 10 states in Southeast Asia.
Feelings Towards China
On average, a significant share of respondents from all 10 countries are worried about rising influence from both the U.S. and China.
However, overall skepticism is higher for China, at 74% (versus 59% for U.S.).
| Country | Worried About Growing 🇨🇳 Influence | Welcome Growing 🇨🇳 Influence |
|---|---|---|
| 🇧🇳 Brunei | 58% | 42% |
| 🇰🇭 Cambodia | 66% | 34% |
| 🇮🇩 Indonesia | 57% | 43% |
| 🇱🇦 Laos | 68% | 32% |
| 🇲🇾 Malaysia | 56% | 44% |
| 🇲🇲 Myanmar | 95% | 5% |
| 🇵🇭 Philippines | 81% | 19% |
| 🇸🇬 Singapore | 74% | 26% |
| 🇹🇭 Thailand | 84% | 16% |
| 🇻🇳 Vietnam | 96% | 4% |
| Average | 74% | 27% |
The recently-cooled but still active territorial concerns over the South China Sea may play a significant role in these responses, especially in countries which are also claimants over the sea.
For example, in Vietnam over 95% of respondents said they were worried about China’s growing influence.
Feelings Towards America
Conversely, rising American influence is welcomed in two countries with competing claims in the South China Sea, the Philippines (69%) and Vietnam (55%).
| Country | Worried About Growing 🇺🇸 Influence | Welcome Growing 🇺🇸 Influence |
|---|---|---|
| 🇧🇳 Brunei | 73% | 27% |
| 🇰🇭 Cambodia | 58% | 42% |
| 🇮🇩 Indonesia | 73% | 27% |
| 🇱🇦 Laos | 79% | 21% |
| 🇲🇾 Malaysia | 68% | 32% |
| 🇲🇲 Myanmar | 45% | 55% |
| 🇵🇭 Philippines | 32% | 69% |
| 🇸🇬 Singapore | 37% | 63% |
| 🇹🇭 Thailand | 80% | 20% |
| 🇻🇳 Vietnam | 45% | 55% |
| Average | 59% | 41% |
Despite this, on a regional average, more respondents worry about growing American influence (59%) than they welcome it (41%).
Interestingly, it seems almost every ASEAN nation has a clear preference for one superpower over the other.
The only exception is Thailand, where those surveyed were not a fan of either option, with 84% worried about China, and 80% worried about the U.S.

-

 Culture6 days ago
The World’s Top Media Franchises by All-Time Revenue
-

 Science2 weeks ago
Visualizing the Average Lifespans of Mammals
-

 Brands2 weeks ago
How Tech Logos Have Evolved Over Time
-

 Energy2 weeks ago
Ranked: The Top 10 EV Battery Manufacturers in 2023
-

 Countries2 weeks ago
Countries With the Largest Happiness Gains Since 2010
-

 Economy2 weeks ago
VC+: Get Our Key Takeaways From the IMF’s World Economic Outlook
-

 Demographics2 weeks ago
The Countries That Have Become Sadder Since 2010
-

 Money1 week ago
Charted: Who Has Savings in This Economy?